|
|
|
|
|
This software was checked for viruses and was found to contain no viruses.
Click here
to see antivirus report.
|
|
| |
|
|
Video tutorial for Graphing Calculator 3D 3.2
|
Review
This is official description
- Plot regular and parametric equations.
- Plot coordinates tables. Graphing Calculator 3D is an easy-to-use tool that plots 2D and 3D functions. Graphing Calculator 3D features :
- Instant quick plotting after each key stroke.
- Cartesian/Polar coordinates in 2D.
- Cart/Cylindrical/Spherical coordinates in 3D.
- Inequalities in 2D and 3D.
- Animation and variable slider in 2D and 3D.
- Rotate and zoom in the graphs in real-time.
- Shade 3D graphs for optimum visualizations.
- Fully customizable axis.
- Import coordinates from excel and csv files.
The following review written by one of the Software Informer contributors applies to version 2.3
This program plots 2D and 3D functions with tools in order to have high quality visualization. You can rotate or customize any part of the axis, and zoom the graphs in real-time. Graphs can be shaded with customized gradual color along the 3 axis. The lighting allows you to have a better visualization of the depth of the surface.
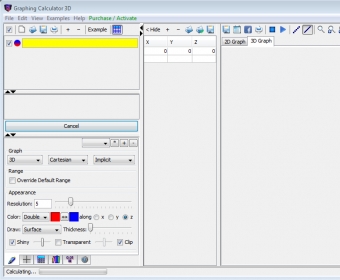
Instructions: You just have to type a function in the empty function text box. You can add more function text boxes by clicking on the yellow pencil button labeled "Add new equation". After introducing the function just press ENTER key or push the button "Redraw All". All functions are plotted by default in 3D mode, but you can select the type 2D or 3D in the "Draw attributes" window. Once the graph is plotted you can rotate or zoom the graph in order to have a better visualization by clicking the left key of the mouse and dragging the mouse. The graph will rotate in real-time. With the scroll wheel you can zoom in or zoom out the graph. You can use the Graphic Keyboard window to use functions, constants, degrees, radians, fractions, etcetera. With the "Draw Attributes" window you can adjust the resolution of the graph, change colors, thickness, etcetera. |
- Fast plot and high quality graphs
|
- It can crash or exit because an old driver for your computer's graphics cards.
- In order to solve this problem download the latest driver for your graphics card from the manufacturer's website and install it.
|
|
Reviewed by: Roberto Jimenez Reviewer rating: Reviewed: 3 years ago
|
|
Report a wrong version
Report a wrong program title
Suggest a correction
|
Screenshots
|